
Wellness program ROI is the financial return an employer earns for every dollar spent on employee health initiatives. Research benchmarks range from $1.50 to $3.00 per dollar invested, with mature, multi-component programs reaching up to $6.00, per a 2010 Harvard meta-analysis by Baicker et al.
Employee wellness has evolved from a nice-to-have perk into a business necessity. Organizations are investing actively in employee wellbeing, yet many leadership teams still question whether these investments are generating measurable business value and ROI.
In current times, wellness program ROI benchmarks often range from $1.50 to $3.00 for every dollar invested, with some mature programs reporting even higher returns. Yet, most HR teams still struggle to produce a defensible number when leadership asks. Vantage Fit is a corporate wellness platform that helps organizations run, measure, and report on program ROI for workforces of 500 to 10,000+.
This blog covers the ROI formula, measurement timelines, industry benchmarks, and a free calculator to help you build a stronger business case for employee wellness.
Key Takeaways
- Wellness program ROI: $1.50 to $3.00 per $1 invested; up to $6.00 in mature, multi-component programs
- ROI measures hard financial returns (healthcare, absenteeism, turnover); VOI captures engagement, retention, and morale
- Formula: (Benefits − Costs) ÷ Costs × 100
- Expect engagement signals in months 0–6, absenteeism data by month 12, healthcare claims by months 18–24, and full ROI by months 24–36
- Research is mixed: Baicker (2010) found $3.27 per $1 in medical savings; a 2019 JAMA randomized trial found no significant short-term effect
What Is the ROI of an Employee Wellness Program?
Wellness program ROI is the financial return an employer earns for every amount spent on a wellness program. Usually, ROI range from $1.50 to $3.00 per $1 invested. And mature programs report up to $6.00 ROI.
Those figures come from two foundational sources. A 2010 Harvard meta-analysis by Baicker et al. found $3.27 in reduced medical costs and $2.73 in reduced absenteeism costs per dollar spent. An HBR analysis of Johnson & Johnson's program reported $250 million in healthcare savings over a decade, a return of $2.71 per $1 invested.
The range is wide because results depend on program type, workforce risk profile, and measurement timeframe. The benchmarks section below breaks this down by program category.
ROI vs. VOI: What Each One Measures
ROI measures hard financial returns such as reduced healthcare claims and absenteeism costs. VOI, or value on investment, captures outcomes that resist dollar conversion: engagement, retention, morale, and employer brand.
| Dimension | ROI | VOI |
|---|---|---|
| What it counts | Healthcare savings, absenteeism reduction, turnover avoidance | Engagement, morale, retention, employer brand |
| Example metrics | Claims cost per employee, absent days, turnover rate | eNPS, pulse survey scores, manager satisfaction ratings |
| Time horizon | 12–36 months for full ROI data | Signals visible within 6 months |
| Who asks | CFO, finance team | CHRO, people team |
Deepshika Bhowmick, HR Consultant, made the business case for wellness ROI on the Vantage Fit Podcast:
"When you're in good health, it reduces absenteeism, reduces presenteeism — being physically present but not fully productive — and reduces turnover. People are 20% more likely to work and stay in an organisation with a well-established employee wellness program. 84% of employees report that wellness programs improve their overall wellbeing."
— Deepshika Bhowmick, HR Consultant | Listen to the full episode
Turnover is one factor where ROI and VOI intersect. Replacing an employee can cost $15,000 to $25,000 in recruiting, onboarding, and lost productivity. When a wellness program helps retain employees, it reduces these expenses and generates measurable savings. As a result, improved retention can move beyond being just a VOI indicator and become a quantifiable ROI metric.
Beyond financial metrics, organizations also need a way to measure the less tangible benefits of wellness programs. Pulse surveys and eNPS are among the most widely used tools for measuring VOI. They help quantify changes in employee sentiment, engagement, and overall workplace experience.
For instance, Vantage Fit links eNPS scores directly to specific wellness campaigns, enabling HR teams to track sentiment trends and correlate them with employee engagement over time.
Related: How wellness programs support employee retention and Benefits of employee wellness programs
How to Calculate Wellness Program ROI: Formula and Worked Example
ROI = (Program Benefits − Program Costs) ÷ Program Costs × 100
Wellness program costs include platform or vendor fees, incentives, biometric screenings, and staff coordination time. The cost of corporate wellness programs typically runs $150 to $1,200 per employee per year depending on scope.
Program benefits include three measurable savings categories:
- Healthcare: Industry data puts average savings at $250 per employee per year for programs that reduce healthcare claims (per RAND 2013 analysis).
- Absenteeism: Regular physical activity correlates with fewer absent days annually.
- Turnover: Replacing one employee costs $15,000 to $25,000 (per SHRM analysis); even a small reduction in turnover rate adds up quickly.
Sample Wellness Program ROI Calculation for a 500-Employee Company:
| Input | Value |
|---|---|
| Annual program cost | $200,000 ($400/employee) |
| Healthcare savings ($250 × 500) | $125,000 |
| Absenteeism savings (4 days × avg $250/day × 400 participants) | $400,000 |
| Turnover savings (1% reduction × 5 employees × $20,000) | $100,000 |
| Total benefits | $625,000 |
ROI = ($625,000 − $200,000) ÷ $200,000 × 100 = 213%, or roughly $3.13 per $1 invested.
The numbers above are just projections. Actual results depend on participation levels, program intricacy, and the measurement timeline.
The Wellness ROI Measurement Timeline: Baseline to 36 Months
On average, it takes 12 to 36 months to find out the ROI on a wellness program accurately. Establish a baseline by recording key metrics before launch. Once the program is active, track participation and engagement during the first 6 months, monitor absenteeism by month 12, and evaluate healthcare claims between months 18 and 24. By months 24 to 36, you can evaluate long-term healthcare cost reductions, sustained retention gains, and overall program ROI.
Before launch (baseline): A health risk assessment is the standard baseline instrument. It provides aggregate workforce data without exposing individual health records. Record current healthcare claims cost per employee, average absenteeism, and turnover rate. Vantage Fit’s HRA reports aggregate-only scores, giving HR a defensible before-state while protecting employee privacy.
Months 0–6 (engagement signals): After the wellness program is live, track participation rate (enrolled divided by eligible) and engagement rate (sustained active use week over week). These are leading indicators to study a wellness program's efficiency. Industry benchmarks for sustained participation sit at 20–30%. If the percentage exceeds this threshold, then the organization is generally more likely to achieve the engagement levels needed to drive improvements in the key metrics and other ROI metrics over time.
Month 12 (absenteeism): Compare absenteeism against the pre-launch baseline metrics. To reduce participation bias, compare participants with a similar group of non-participants rather than using the company-wide average.
Months 18–24 (healthcare claims): Healthcare claims take time to reflect meaningful changes. Most insurers recommend analyzing at least 18–24 months of post-program claims data before drawing conclusions about cost savings. Avoid estimating healthcare ROI based solely on early engagement metrics.
Months 24–36 (ROI validation): By this period, you will have enough data to evaluate long-term trends in healthcare costs, absenteeism, and retention. Compare outcomes against the pre-launch baseline to validate whether improvements have been sustained. This is also the ideal period to assess whether initial gains were temporary or indicative of lasting habits.
Related: How to evaluate a wellness program
Wellness Program ROI Metrics to Track
Seven metric families feed the ROI formula. Each matures on a different timeline, so track them against a pre-launch baseline rather than in a single snapshot.
| Metric | Definition | Data source | When it matures |
|---|---|---|---|
| Participation rate | Enrolled ÷ eligible employees at a point in time | Platform enrollment data | Month 1+ |
| Engagement rate | Sustained active use week over week (not the same as participation) | Platform activity logs | Months 1–6 |
| Absenteeism | Absent days per employee vs. baseline | HRIS / payroll | Month 12 |
| Presenteeism | Productivity lost while present at work | WPAI or SPS-6 survey | Months 6–12 |
| Healthcare claims | Employer-paid claims cost per employee vs. baseline | Insurer data | Months 18–24 |
| Turnover rate | Voluntary departures ÷ average headcount | HRIS | Month 12+ |
| Overall program ROI | Aggregate healthcare savings, absenteeism reduction, and retention gains vs. baseline | All sources combined | Months 24–36 |
Participation vs. engagement: These metrics are not interchangeable. Participation measures how many employees sign up, while engagement measures how many continue to participate over time. Using participation data as a proxy for engagement can flood the program's impact and lead to inflated ROI projections.
Want to model these metrics yourself? Use the free Employee Wellness ROI Calculator to model these seven metrics against your own headcount and program cost before launch.
Related: Employee wellbeing metrics explained
Measuring Presenteeism: WPAI and SPS-6
Presenteeism is when an employee is at work but with no productivity. The typical reasons are chronic conditions, pain, or poor mental health. Presenteeism is the largest and most under-measured driver of wellness ROI.
Two validated instruments quantify it:
- WPAI (Work Productivity and Activity Impairment): It is a six-question survey asking about hours missed, hours worked, and a 0–10 impairment rating for absenteeism and presenteeism combined
- SPS-6 (Stanford Presenteeism Scale): It is a six-item scale measuring how much a health condition interferes with completing tasks and concentrating at work
How to convert presenteeism to dollars: Multiply the impairment percentage by the employee’s loaded hourly cost. A worker earning $50,000 per year with 10% presenteeism impairment represents roughly $5,000 in annual productivity loss. CDC workplace health promotion guidance includes presenteeism as a standard ROI component for this reason.
What the Research Actually Says About Wellness ROI
Research studies on wellness ROI have mixed data. A 2010 Harvard meta-analysis found $3.27 in medical savings per dollar spent. On the other hand, a 2019 JAMA randomized trial found no significant short-term effect. The gap in this case exists due to program design, measurement timeframe, metrics measured, and participation bias.
| Study | Finding | Notes |
|---|---|---|
| Baicker et al. 2010, Health Affairs | $3.27 medical savings + $2.73 absenteeism savings per $1 | Meta-analysis of 22 studies; programs averaged 3.7 years in duration |
| RAND 2013 | ~$1.50 overall; $3.80 disease management vs. $0.50 lifestyle management | Largest employer-based study to date; result depends heavily on program type |
| Song & Baicker 2019, JAMA | No significant effect at 18 months | Randomized controlled trial; no measurable impact on clinical or financial outcomes |
| PubMed 32967587 | $1.585 per $1 invested; not statistically significant | Systematic review; modest positive trend but wide confidence intervals |
| HBR 2010 (Johnson & Johnson) | $2.71 per $1 over a decade; $250M total savings | First-party employer data; multi-component program running more than 10 years |
Why the results diverge: (1) Program design: disease management programs consistently outperform lifestyle-only programs. (2) Timeframe: the 2019 JAMA RCT measured 18-month outcomes; most positive meta-analyses drew on programs running 3 to 7 years. (3) Metrics: studies counting only claims data missed presenteeism and turnover gains. (4) Participation bias: healthier employees self-select into wellness programs, inflating pre/post comparisons that lack control groups.
Related: Do wellness programs reduce healthcare costs?
Wellness ROI Benchmarks by Program Type, Company Size, and Industry
Wellness ROI benchmarks vary by program type. As per most recent data, RAND found disease management programs returned $3.80 per $1 invested while lifestyle management returned $0.50. Previous studies showed that full multi-component programs averaged $2.71 to $3.27 per dollar.
| Program type | ROI benchmark | Source | Notes |
|---|---|---|---|
| Disease management | $3.80 per $1 | RAND 2013 | Chronic condition management; highest ROI category |
| Multi-component | $2.71–$3.27 per $1 | HBR 2010 / Baicker 2010 | Long-running programs (3+ years) including fitness, nutrition, and EAP |
| Lifestyle management | $0.50 per $1 | RAND 2013 | Stand-alone fitness or nutrition programs without chronic condition focus |
| Financial wellness | Reduced turnover, improved engagement | Qualitative / SHRM | Hard ROI data limited; financial stress reduces productivity, so programs address a measurable cost |
Size and industry considerations: ROI varies by organization size and industry as well. Larger, self-insured employers often see healthcare cost savings sooner because they bear claims costs directly. Other industries such as manufacturing, logistics, and healthcare may experience greater reductions in absenteeism from wellness programs because their baseline absence rates tend to be higher.
For current industry data, the 2026 Global Workplace Well-being Industry Report includes benchmark participation and engagement data across sectors.
Related: Employee wellbeing statistics
Calculate Your Own Wellness ROI in Five Minutes
A wellness ROI calculator estimates program return from four inputs:
- employee count
- average salary
- current absenteeism data
- program cost
It projects healthcare, absenteeism, and turnover savings against annual program spend.
Here is how to use the free employee wellness ROI calculator:
- Enter your headcount and average salary. The calculator uses salary to estimate the daily productivity cost of absenteeism.
- Enter your current absenteeism rate. Use HRIS data from the 12 months before program launch. This becomes your baseline.
- Enter your estimated annual program cost. Include platform fees, incentives, screenings, and staff coordination time.
- Review projected savings. The output shows estimated healthcare, absenteeism, and turnover savings against your program cost as a projected ROI ratio.
- Validate against the timeline. Use the output as a planning estimate. Check actual results against these projections at month 12 and month 24.
ROI Measurement Toolkit
Pair the calculator with these free resources:
- Corporate wellness budget template: Calculate the cost side of the ROI formula
- Employee wellness survey template: Find the VOI and engagement baseline
- Corporate wellness program proposal template: Find the pitch to build the business case to leadership
Wellness ROI in Practice: Results From Real Programs
Tata Motors’ Step & Stride initiative in collaboration with Vantage Fit reached 59% engagement across 1,248 participants, and IBS Software’s March to Fitness reached 88% engagement in 28 days.
Tata Motors Step & Stride (6-month pilot) 1,248 participants; 59% engagement rate; 6,246 average daily steps. Read the Tata Motors case study.
IBS Software March to Fitness (March 2024) Over 500 employees enrolled; 88% engagement; 236 participants hit 30,000+ steps per week by week 3 of the 28-day program. Read the IBS Software case study.
Brazosport ISD Fit Wars (US, 2-week campaign) 86% engagement rate; average BMI moved from 30 to approximately 27 over the program period. Read the Brazosport ISD case study.
These are month 0–6 engagement indicators, the leading metrics from the measurement timeline above. They confirm participation levels high enough to sustain a program long enough to reach absenteeism and healthcare claims data.
Proving results to a CFO is all about showing the numbers in a well put together presentation. This is why, Vantage Fit’s analytics dashboard produces exec-ready CSV and PDF exports filterable by department, location, and date. That is the reporting format behind the figures above and the format leadership needs for a budget meeting.
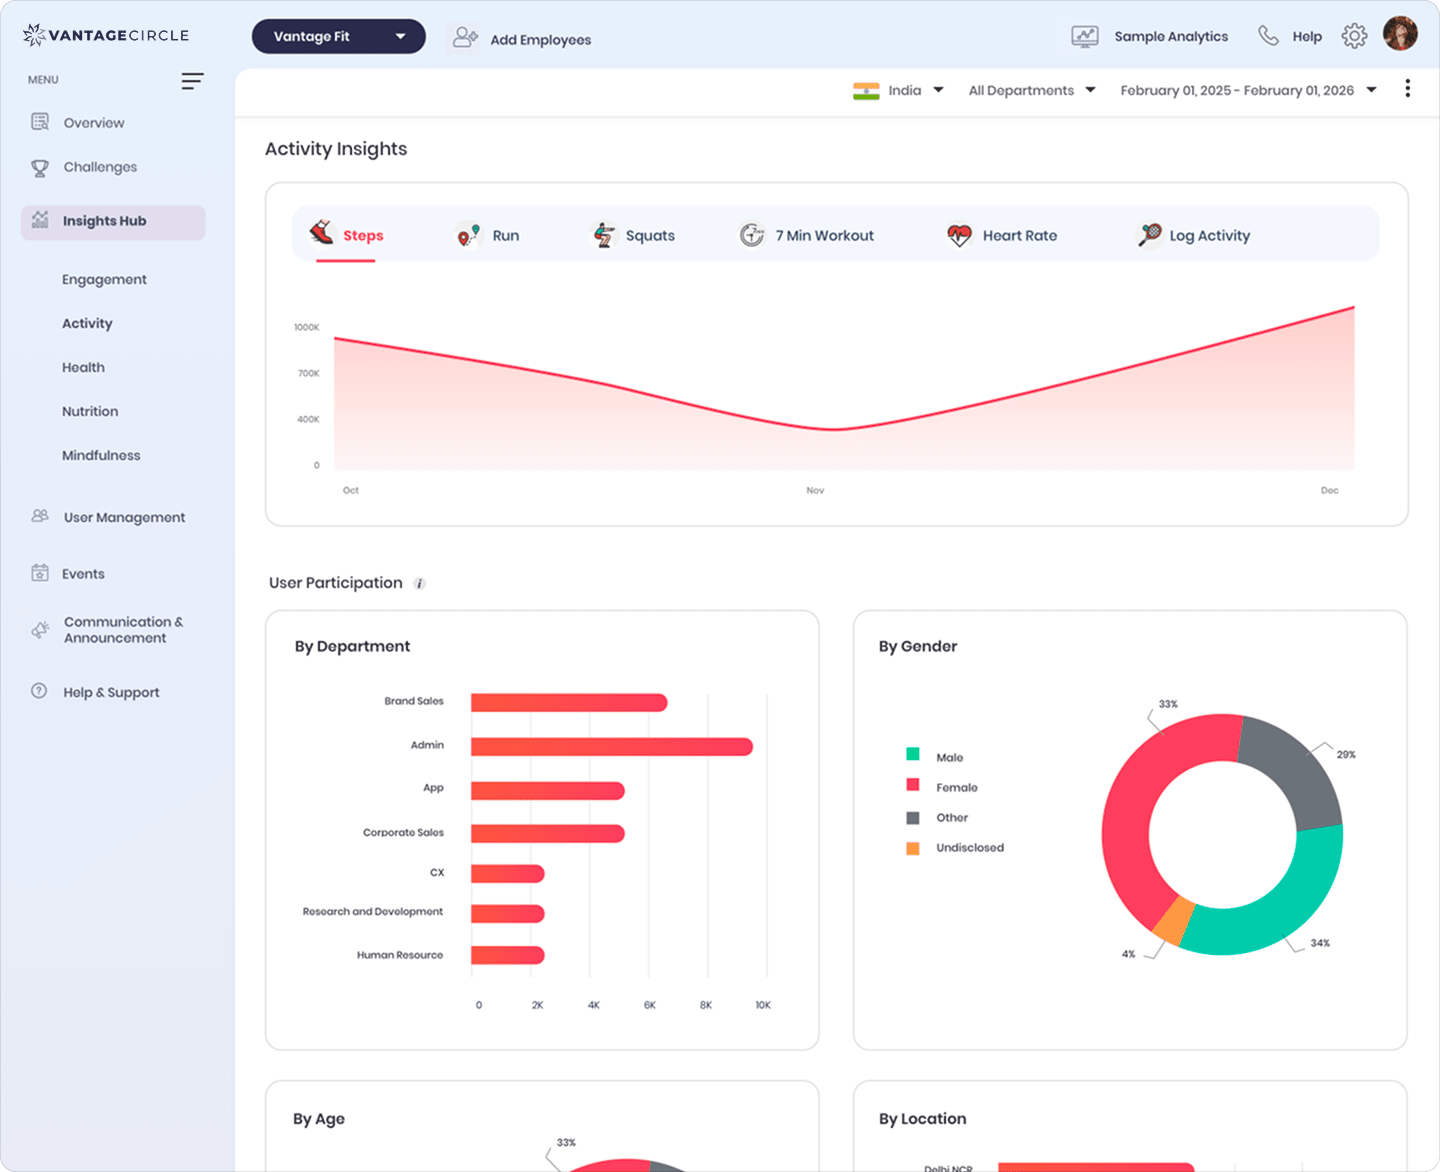
"The analytics provided clear insights into participation levels, helping us make data-driven decisions."
— Shubham Sanghavi, Avalon Consulting
Related: Employee engagement in wellness programs
Frequently Asked Questions
What is the average cost of a wellness program per employee?
The cost of wellness programs ranges from $150 to $1,200 per employee per year depending on scope. Cost of basic digital programs sit at the lower end. And full programs with biometric screenings, and incentives sit at the higher end of the price range.
How long until a wellness program shows ROI?
Expect 12 to 36 months for a full picture. Engagement signals appear within the first 6 months. Absenteeism data becomes reliable around month 12. Healthcare claims take 18 to 24 months to reflect program impact. By months 24 to 36, long-term cost reductions, sustained retention gains, and overall ROI become measurable.
Do wellness programs have better ROI than retention bonuses?
Wellness programs and retention bonuses address different problems. Retention bonuses buy short-term commitment but do not change the conditions that cause turnover. Wellness programs compound over time through lower absenteeism, reduced healthcare claims, and a lower turnover rate.
Do wellness programs reduce healthcare costs?
Evidence is positive but mixed. Industry data puts average savings at $250 per employee per year for programs that reduce claims.
What is a good ROI benchmark for a wellness program?
Benchmarks depend on program type. RAND found disease management programs returning $3.80 per $1 and lifestyle management returning $0.50. Multi-component programs in earlier meta-analyses averaged $2.71 to $3.27 per dollar.
What is the difference between participation rate and engagement rate?
Participation rate is the share of eligible employees enrolled in the program at a point in time. Engagement rate measures sustained active use week over week.
Measure First, Then Scale
Wellness program ROI runs from $1.50 to $3.00 per dollar invested in published benchmarks, with disease management programs reaching $3.80 and lifestyle-only programs returning closer to $0.50. The formula is straightforward; setting the timeline for measuring the program is what most organizations skip.
Establish a baseline before launch, track engagement in the first six months, measure absenteeism at month 12, and hold off on claiming healthcare ROI until months 18 to 24. Try the employee wellness ROI calculator to project your numbers before you start, then validate against real data as the program runs.