Trends give you a quick visual snapshot of how your fitness metrics have changed over the past seven days. You'll find them right on your Summary tab, just below the activity rings, so you can spot patterns at a glance without digging through detailed logs.
Where to Find Trends
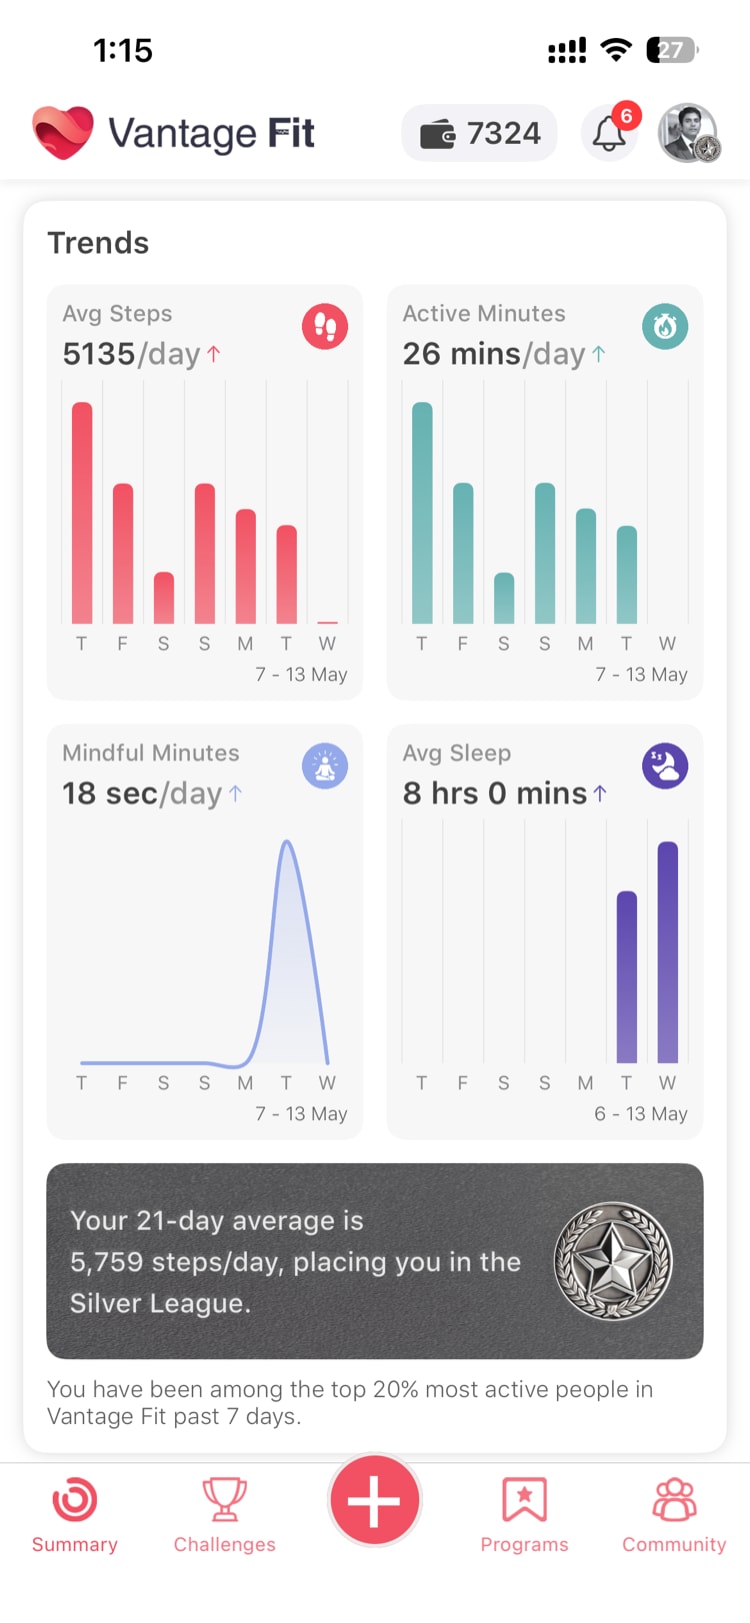
Scroll down on the Summary tab, past your daily activity rings. The Trends section appears as a set of small graphs, each representing a different metric. These graphs update automatically as new data comes in throughout the day.
What Each Graph Shows
Trends display up to four metrics, depending on your company's configuration:
Steps (Bar Graph)
A bar chart showing your daily step count for each of the last seven days. Taller bars mean more steps. This graph is available in both Lite Mode and Full Mode.
Active Calories / Active Minutes (Bar Graph)
A bar chart showing either your active calories burned or active minutes logged each day, depending on which metric your company tracks. Like steps, this is available in both modes.
Mindful Minutes (Line Graph)
A line graph tracking your daily mindful minutes over the week. This metric is only available in Full Mode -- if your company uses Lite Mode, you won't see this graph.
Sleep (Bar Graph)
A bar chart showing your logged sleep duration for each of the past seven days. Like mindful minutes, sleep trends are only available in Full Mode.
Note: If your company uses Lite Mode, you'll only see Steps and Active Calories/Minutes trends. The Mindful Minutes and Sleep graphs appear exclusively in Full Mode.
Reading the Graphs
Each graph plots seven days of data, with the most recent day on the right. The vertical axis scales automatically based on your data range for that week.
- Bar graphs (steps, active calories/minutes, sleep) show distinct daily totals as individual bars
- Line graphs (mindful minutes) connect daily values with a continuous line, making it easier to see gradual changes
Below each graph, you'll see your daily average for the displayed week. This gives you a quick benchmark -- if today's bar is taller than the average line, you're having an above-average day.
When a Graph Shows "(+add)"
If a graph appears empty with a (+add) prompt, it means you haven't logged any data for that metric during the past seven days. Tapping (+add) takes you directly to the logging screen for that metric so you can start tracking.
For auto-tracked metrics like steps, an empty graph usually means your phone's motion sensors or a connected wearable haven't synced data recently. Check your device permissions or wearable connection in Settings.
Tip: If your steps graph is empty but you've been walking with your phone, go to Settings > Connected Devices and make sure your health data source (Apple Health, Google Fit, or your wearable) is properly connected.
How Trends Help You
Trends are designed for quick pattern recognition:
- Consistency check -- Are you hitting similar numbers each day, or are there big gaps on weekends?
- Progress tracking -- Is your daily average climbing week over week?
- Motivation -- Seeing a streak of solid bars can reinforce good habits
They're not meant to replace the detailed views you get in the Diary or activity-specific screens. Think of Trends as a fast Summary Page read before you dive deeper.
Need more help? Contact support from Settings → Help in the app.
Related articles: